









Google Maps™ is a trademark of Google LLC.


Asset Intelligence provides visual map-based views of unit-level data, streamlining analysis and enabling precise, data-driven decision making.
Leverage a suite of feature-rich benefits to inform and enhance your property strategy.
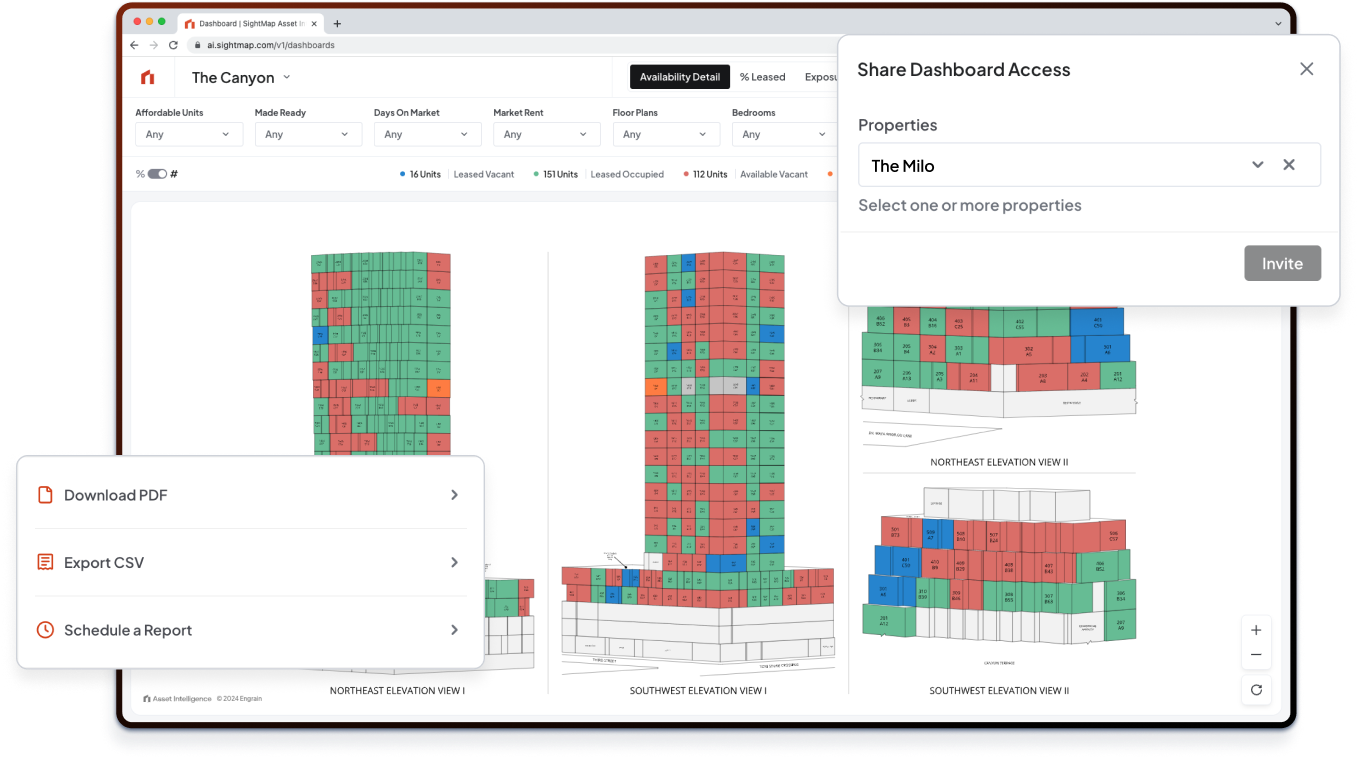
Bring your team and clients into Asset Intelligence, and never miss a week of performance data.

Bring a colleague or client into your Asset Intelligence dashboard in a few clicks. Faster access, wider visibility, more people working from the same data.
Schedule performance snapshots that land in your inbox every Monday. 30 days of history stay available right inside the platform.
"We're building out visuals for our clients as well, and they really appreciate that level of insight and context."

Associate Vice President of Technology
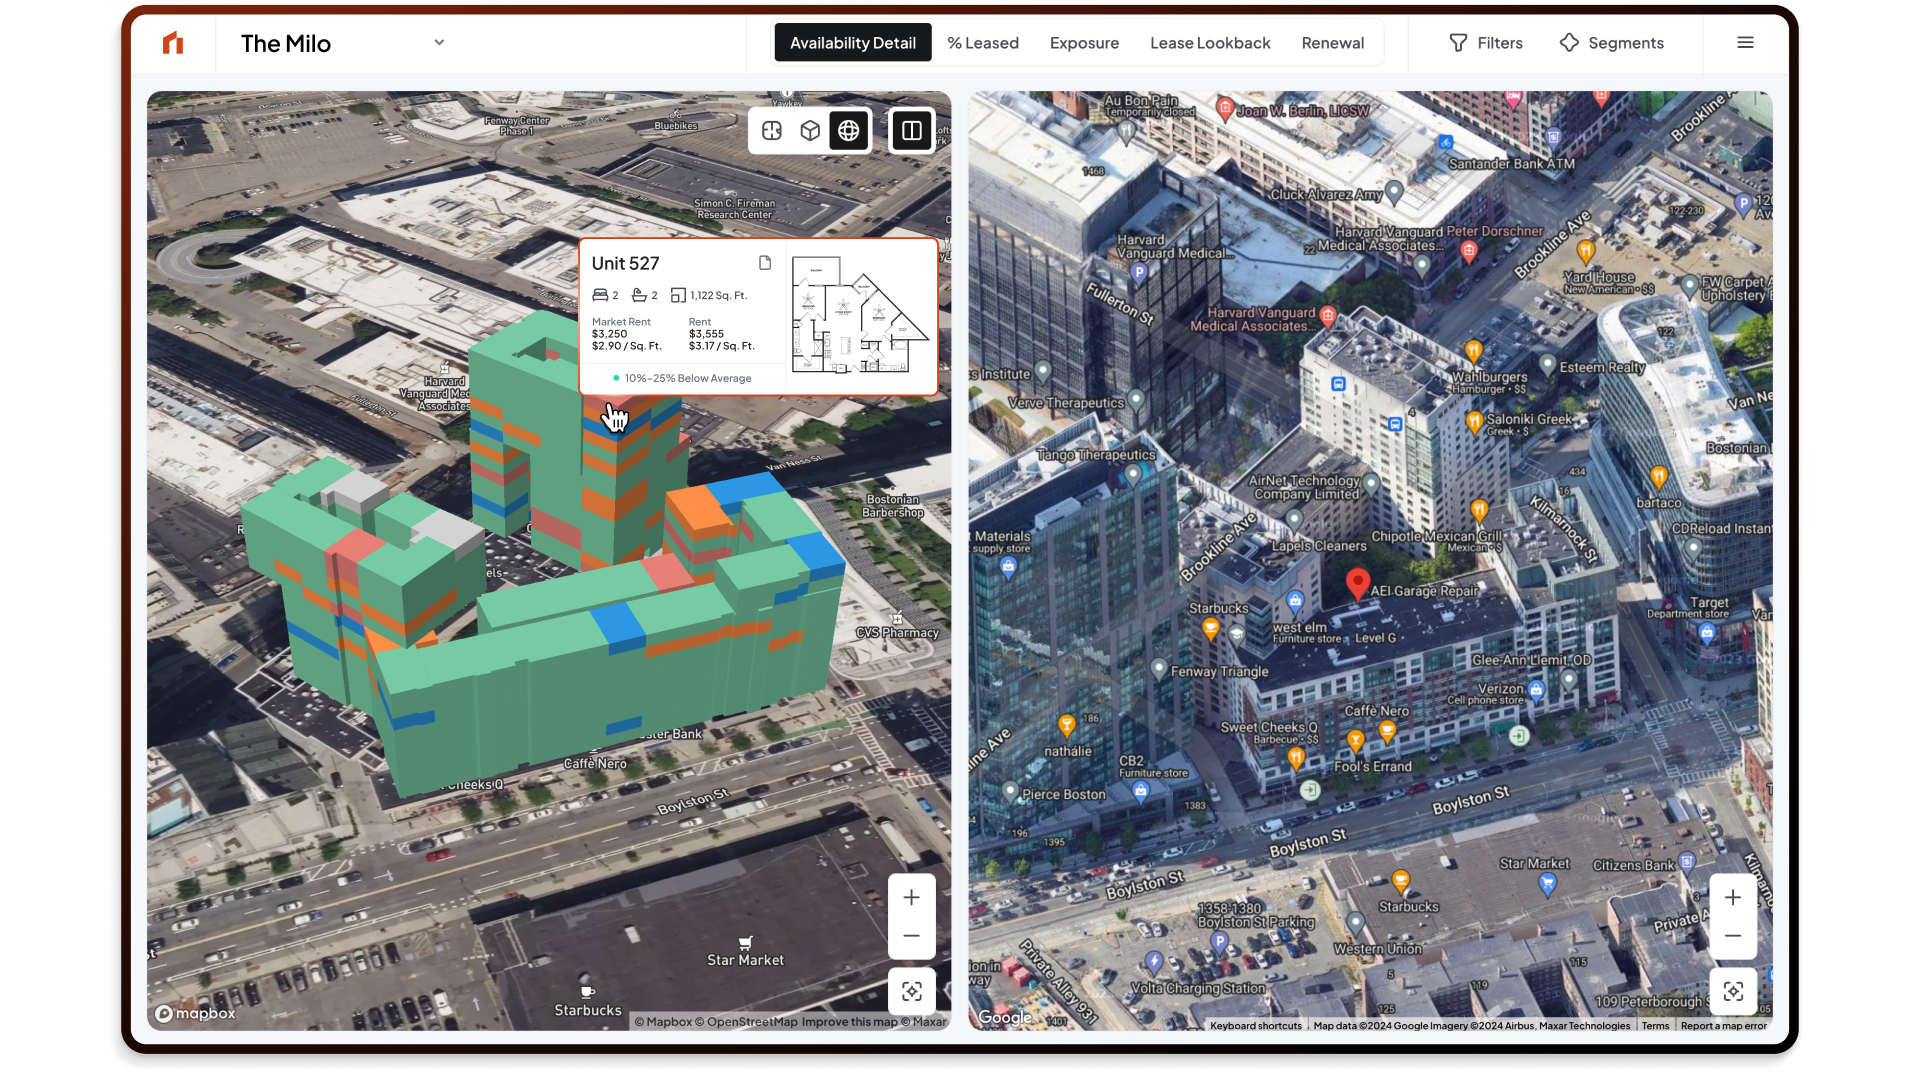
Choose from four customized map views to match your property type.
Google Maps™ is a trademark of Google LLC.
Engrain’s Power BI Plugin seamlessly integrates with Microsoft Power BI for a smarter and more custom data-driven approach.


“A visualization for buildings is especially important for garden communities, or where the units don’t exactly stack and are not equal size. We needed a more comprehensive way to identify pricing outliers and trends based on building location and to audit amenities. It’s difficult to audit amenities and really understand where specific units are located within a building, what they face, and other key details that help us price.”
Asset Intelligence easily allows us to speak to absorption by unit type, view or floor preference. I use it when discussing new pricing strategies with our management companies and when I have internal conversations with our developers. They are often curious about what floor plans lease well or those that might not move quite as fast so we can use the information on future sites.
As we’re looking at which unit types are going to lease the best, square footages and potential demographic needs, the ability to retrieve the Asset Intelligence reporting for previous communities in the area really helps.
We needed the insight to quickly adjust rents as we see absorption pick up on certain unit types. It enables us to make better decisions on what types of units and sizes we’re putting into our new developments.
“We’ve replaced all the spreadsheets with a fully integrated, interactive map of each community suited with custom dashboards that exhibit specific and vital information. We can easily aggregate and access leasing percentages, financial components, resident feedback and really any other data-centric information we may be looking for.”
"The biggest benefit is looking at trends based on location within a community. It’s extremely helpful for us internally when we look at the information and consume it in that visual format, but on the other end of it, we’re building out visuals for our clients as well and they really appreciate that level of insight and context."


Lorem ipsum dolor sit amet conse ctetur. Sed vulputate vitae viverra faucibus cursus volutpat accumsan. Lacus tortor ac.
Lorem ipsum dolor sit amet conse ctetur. Sed vulputate vitae viverra faucibus cursus volutpat accumsan. Lacus tortor ac.
Lorem ipsum dolor sit amet conse ctetur. Sed vulputate vitae viverra faucibus cursus volutpat accumsan. Lacus tortor ac.
Lorem ipsum dolor sit amet conse ctetur. Sed vulputate vitae viverra faucibus cursus volutpat accumsan. Lacus tortor ac.
Lorem ipsum dolor sit amet conse ctetur. Sed vulputate vitae viverra faucibus cursus volutpat accumsan. Lacus tortor ac.

Dive into a world of data-driven decisions and streamlined operations with Asset Intelligence.


